Introduction
`Osteoporosis is defined as “a disease characterized by low bone-mass and microarchitectural deterioration of bone tissue, leading to enhanced bone fragility and a consequent increase in fracture risk. The risk factors for the development of osteoporosis include ageing, menopause, insufficient consumption of foods containing calcium, familial education and decreased physical activity.1
`Human bones decrease in density and increase in porosity beginning in approximately the third decade of life. It is well known that osteoporosis results in reduced jaw bone mass, as well as alterations of the mandibular structure, especially of the inferior border. 2 There have been reports linking osteoporosis to alterations of the trabeculae displayed on dental radiographs. These findings suggest that dental radiographs may have a useful role in screening patients for osteoporosis. Because radiographic assessment of bone mineral density and bone height is of great value in planning further dental treatment, panoramic or periapical radiographs are routinely made before treatment planning. 3
Single- or dual-photon absorptiometry, quantitative computed tomography QCT), single- or dual-energy X-ray absorptiometry DXA) and quantitative ultrasound are among the techniques developed to identify individuals with skeletal osteoporosis. Dual-energy x-ray absorptiometry (DXA) is considered to be the reference-standard examination for BMD assessment and the best predictor of fracture risk.4 DXA is used extensively around the world as it has a high reliability in identifying individuals with low BMD and delivers a low radiation dose. 4
A number of mandibular cortical indices, including the mandibular cortical index (MCI), mandibular cortical width (MCW) and panoramic mandibular index (PMI), AI (Antegonial index)have been developed to assess and quantify the quality of mandibular bone mass and to observe signs of resorption on panoramic radiographs for identification of osteopenia. 5
The reliability of the radiomorphometric studies have previously been established by several studies in comparsion to DXA. 6 However we are of the opinion that no single morphometric index can solely determine osteoporotic/osteopenic changes consistently.
Compare values of 6 indices and find correlations if any, between the indices to enable more accurate prediction of the osteoporotic changes.
Materials and Methods
A cross-sectional study was performed with subjects being patients attending OPD at People’s Dental Academy and were evaluated with the means of panoramic radiography which were advised as a part of the required dental treatment purpose between January 2010 to May 2011 who met the following inclusion criteria
Patients older than 40 years of age
Patients of both sexes
Patients with no significant medical history
The radiographs that showed the whole mandible, including condyles and hyoid bone without errors in patient preparation, positioning, exposure or development were included in the study
Exclusion criteria
Patients on medication for other systemic diseases.
Patients on drugs such as estrogen, oral bisphosphonates and systemic glucocorticoids that could possibly affect bone metabolism Patients with a mandibular pathology including fracture of mandible and evidence of odontogenic or non-odontogenic pathologies.
Methodology
Digital panoramic radiographs of 75 adult patients who met the following inclusion criteria were obtained by OPG Machine-Planmeca Proline XC with all radiographs being made by a single radiographer with standard exposure parameters.
Vertical orientation line of the machine was aligned with the patient’s sagittal plane, with the horizontal line (Frankfort plane) parallel to the floor. Patients >40 yrs of age were further divided into the following age groups. Group I - 40-50, Group II - 50-60, Group III - 60-70,Group IV - 70 TO 80 years. Out Of 75 patients there were 45 males and 31 females. 41 patients were dentate and 26 partially edentulous with more than 1 tooth missing, 8 were completely edentulous.
Each radiographic image was given an identification number in order to allow a blind review by two observers. All radiographs were measured with the inbuilt measurement tool available in the software of the panoramic machine. There was a period of 1 month between readings. Another observer also measured the same radiographs to verify interobserver reliability. To quantify intraobserver agreements, panoramic radiographs were randomly selected from the sample and analyzed by a third observer. The following radio morphometric indices were measured bilaterally on each panoramic radiograph.
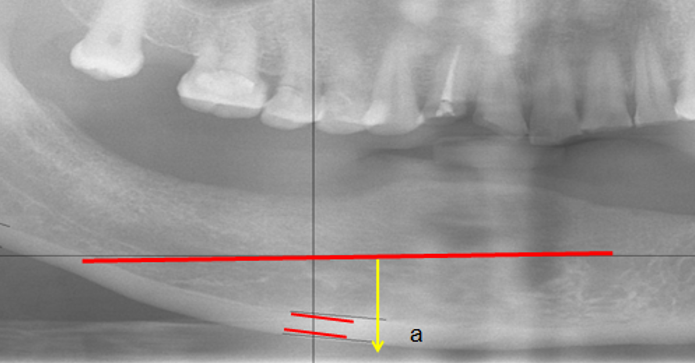
Mental index (MI)
It is the measurement of the cortical width at the mental foramen region. A line parallel to the long axis of the mandible and tangential to the inferior border of the mandible was drawn. A line perpendicular to this tangent intersecting the inferior border of the mental foramen was constructed, along which mandibular cortical width was measured with a caliper. 6
Mandibular cortical index (MCI)
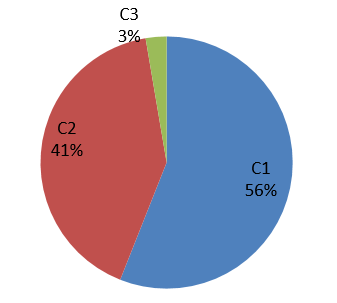
The appearance of the inferior cortex of the mandible was classified as: C1: the endosteal margin of the cortex was even and sharp; C2: the endosteal margin presented semilunar defects (lacunar resorption) or appeared to form endosteal cortical residues; or C3: the cortical layer formed heavy endosteal cortical residues and was clearly porous. 7
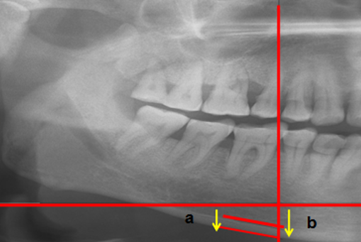
Panoramic Mandibular Index (PMI)
The inferior PMI is the ratio of the thickness of the mandibular cortex to the distance between the inferior margin of the mental foramen and the inferior mandibular cortex
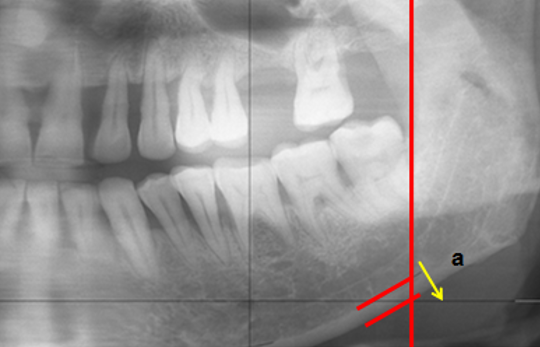
Antegonial index (AI)
It is the measurement of the cortical width in the region anterior to the gonion at a point identified by extending a “best fit” line along the anterior border from the ascending ramus down to the lower border of the mandible. 8
Devlin H et al. in their study gave normal ranges of various mandibular indices and these values were set as standard for grading the patients into the following groups.
Results
Comparison of mean value of indices among age group was done and it was found that
Table 2
ndices depicting age group between the various indices.
| Antegonial index | Sig = .027 |
| Mental index | Sig=.044 |
| Panoramic index | Sig= .196 |
The value for age group was significant for antegonial index and mental index and was insignificant for panoramic index.
Comparison of mean values of indices among male and female groups
Table 3
ndices comparing gender difference between the groups
| Mental index | Sig=.297 Non significant |
| Panoramic index | Sig= 0.980 Non significant |
| Antegonial index | Sig=.067 Non significant |
No statistically significant difference in the mean value of all the indices between male and female. Comparison of mean values of indices among dentate, partially edentulous and edentulous groups
Table 4
Comparing indices value among dentate, edentulous and partially edentulous group
| Antegonial index | Sig=.016 significant |
| Mental index | Sig=.05 significant |
| Panoramic index | Sig=.022 is significant |
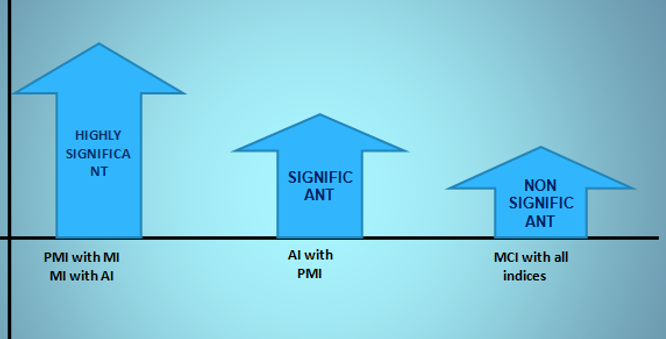
In the group of comparison between the following indices(PMI,MI,AI,MCI) the results are highly significant for all the three indices.
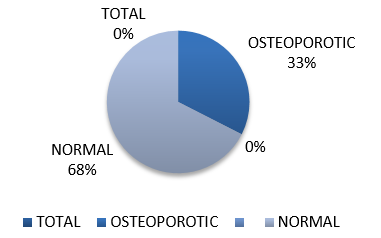
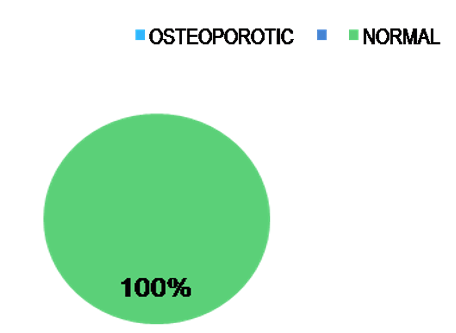
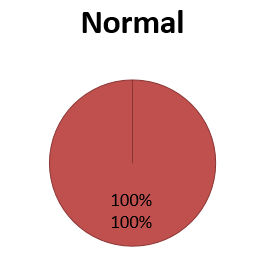
The following diagrams depicts the relation of normal group and the osteoporotic group with the following indices
Discussion
Several panoramic radiographic measurements, also known as panoramic radio morphometric indices, have been developed to assess cortical shape and width, either qualitatively or quantitatively. 7
In our study it was found that with increasing age (60-70and 70-80 years) there was decrease in the value of PMI, AI and MI and was highly significant for MI and AI. Comparison of mean values of indices among male and female groups and it was statistically significant for Antegonial index only wheras PMI and MI showed no difference between gender groups.
Similarly Dutra et al in his study also compared the AI and MI values on 312 panoramic radiographs in terms of sex and age, and reported that there was a notable decrease in antegonial bone thickness among elderly females and that resorption was lower among elderly males. 9
In our study comparison of mean values of indices among dentate, partially edentulous and edentulous groups was also done in which it was found that the value was significant for all the indices and was found that edentulous individuals have lower indices value as compared to dentate individual.
Study by Ledgerton8 et al showed a significant relationship between dental status and
the MCW, PMI, and MCI indices. In another study by Uysal 10 et al MCI was found to be significantly affected by the status of dentition. Our study also had findings similar to Knezovic-Zlataric et al 11 found no difference in the distribution of women and men between MCI categories C2 and C3. He also reported that the age-related distribution of MCI showed an age-related increase in the numbers of individuals with C3 cortex appearance. 11
Benson et al 5 in his study evaluated the MI according to age, race and sex, and observed that mandibular cortical bone thickness decreased with age and the amount of resorption was higher among women..Similarly in our study it was found that on comparing MI and PMI with age race and sex it was found that with increasing age their occurs diff in bone thickness and with gender predilection no such discrepancy is noted. Amount of resorption was more with dentate individual as compared to edentulous patients.
Correlation between the indices were also done in our study and we found that PMI with MI and MI with AI were highly significant and showed similar results whereas MCI was non significamt with the other indices.

